
Couple
For comparisons between partners and romantic relationships. The reading uses language focused on life as a couple, communication, stability and shared decisions.
Comparison between personal charts
Compare two or more sidereal charts and observe how the relationship indicators change over time.
Sinfonia connects the DashaMap charts of the selected people and compares their timing cycles.
The result is presented through a chart, a timeline, four main indicators and, when requested, an explanation focused on the relationship being observed.
It does not use generic descriptions based only on the zodiac sign: it starts from the data and calculations already available in each profile.
Available for couples, families, friendships, professional collaborations and relationships with your companion animal.
Relationship analysis
Each DashaMap profile is calculated separately from the date, time and place of birth.
The system builds the sidereal chart, identifies the Dasha cycles and organizes the personal timeline. Sinfonia uses these existing calculations to compare the selected people over the same period.
This means the comparison is not based on generic categories such as the zodiac sign alone. It considers the complete configuration of each profile and the timing phase each person is moving through.
Sinfonia compares previously calculated personal charts and their timing cycles.
Five contexts
The chart calculations remain unchanged. The context allows indicators, questions and explanations to be presented in a way that is relevant to the selected relationship.
For comparisons between partners and romantic relationships. The reading uses language focused on life as a couple, communication, stability and shared decisions.
For comparing parents, children and other family members. It helps examine different personal periods, communication and family organization.
For observing the course of a friendship through the charts and timing cycles of the people involved.
For colleagues, business partners and collaborators. The reading focuses on communication, collaboration, continuity and professional direction.
If you have activated a Companion Animal subscription, its profile is also available in Sinfonia. You can select the animal alongside the other profiles and compare its chart with that of its owner or other family members. The Companion Animal subscription is compatible with every DashaMap subscription.
Comparison results
After you select the profiles and context, Sinfonia organizes the comparison into four areas.
A concise indicator of the shared movement of the selected charts during the period being observed.
An indicator used to examine how the personal timelines combine in terms of communication.
Compares the timing direction of the profiles and shows when their personal phases are closer together or further apart.
Shows the continuity of the calculated pattern over the selected period.
The indicators describe the period being analyzed. They do not represent a person’s worth or assign a definitive judgment to the relationship.
Field Atlas
The Field Atlas overlays the timelines of the selected profiles. The chart shows how the indicators change during the period being analyzed and compares the movement of each profile with the group’s overall average.
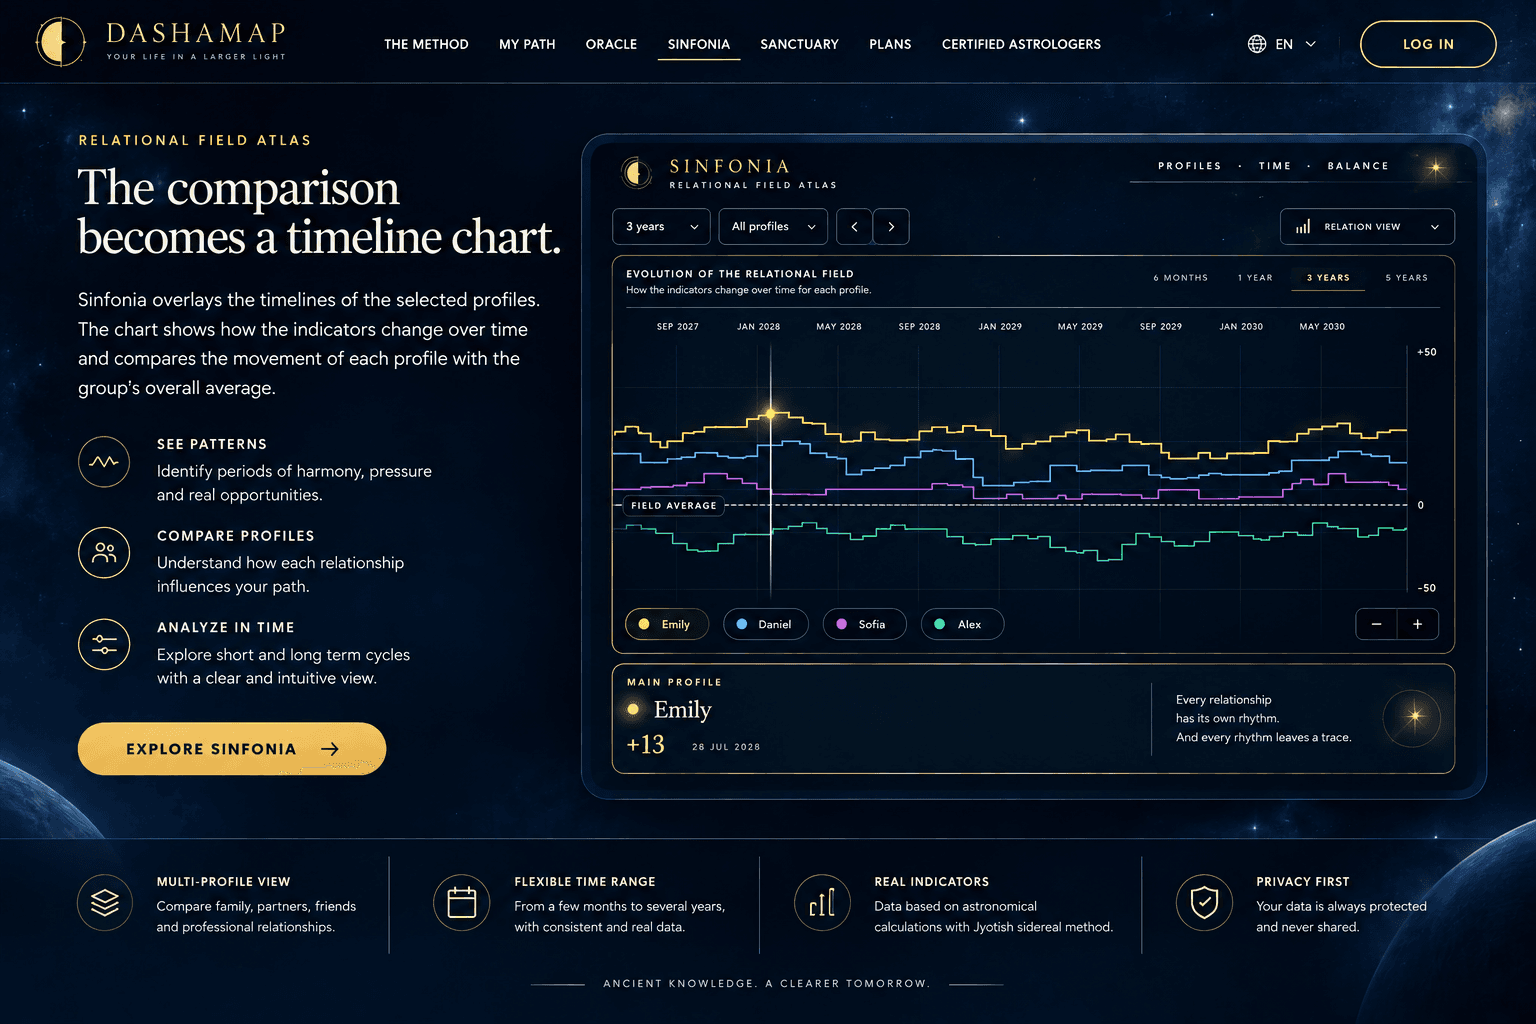
Each selected profile is represented by a distinct line.
Shows the period being analyzed.
Shows the calculated relational index on a fixed scale from -50 to +50, with 0 at the field center.
Summarizes the overall result of the selected combination.
Hovering over a line reveals the point in time and the data associated with that passage.
Illustrative example of the Field Atlas. Personal results are displayed only after sign-in.
Timeline — Kala Path
The Resonance Timeline / Kala Path divides the period being analyzed into intervals and displays the Field Index for each one on a scale from 0 to 100. Each interval is identified in the interface by one of four phases. These phases make the numerical movement over time easier to read. Each card shows the period, the calculated phase and the corresponding index.
The timeline describes the movement of the calculated indicators. It is not a guaranteed prediction of future events.
How the comparison is created
Choose two or more Souls / Atman already present in your DashaMap space. The number of available profiles depends on the active plan.
Indicate whether the comparison concerns a couple, a family, friends, a professional relationship or a companion animal.
Sinfonia retrieves the calculations already stored for each profile and builds the Field Atlas and its timeline.
You can examine the overall result, compare the individual lines and read cohesion, communication, direction and stability.
Ask about the relationship
After opening the comparison, you can write a question about the couple, family, friendship or professional collaboration. The answer uses only the selected profiles, the chosen context and the data already calculated by Sinfonia.
A brief answer focused on the question.
A broader analysis of the data connected to the question and the selected period.
The complete reading accompanied by a PDF document you can keep.
Before submission, the selected answer type and the corresponding conditions of the plan are displayed.
Growing Soul
When a profile registered as a Growing Soul is selected in the Family context, Sinfonia makes the Development Atlas available.
This view organizes information about recurring interests, ways of learning, movement, language, curiosity and practical sensitivity.
Its purpose is to offer parents a structured reading of the characteristics and calculated periods associated with the child’s profile. Availability of the Growing Soul Atlas depends on the active plan.
Recurring interests
Ways of learning
Movement
Language
Curiosity
Practical sensitivity
Calculation and artificial intelligence
The DashaMap engine builds the sidereal charts, calculates the timing cycles and prepares the indicators used by Sinfonia.
Artificial intelligence is used afterwards. It receives the comparison results, the selected context and the user’s question, then organizes them into a clear answer.
The sidereal chart, Dasha cycles, dates and core indicators are not created or modified by artificial intelligence.
Artificial intelligence explains the results of the DashaMap engine; it does not replace the astrological calculation.
Sinfonia
Sinfonia in your DashaMap space
Sign in to DashaMap, select the Souls / Atman and choose the relationship context. Sinfonia will use the stored calculations to build the chart, timeline and comparison indicators.